Agencia Peruana de Noticias PRENSAPERU.PE https://prensaperu.pe/ Twitter: @prensaperupe En el año 2023, la pobreza monetaria afectó al 29,0% de la población del país y aumentó en 1,5 puntos porcentuales respecto al año 2022 (27,5%). En el área urbana fue de 26,4%, incrementándose en 2,3 puntos porcentuales con relación al año anterior; en tanto que, en el área rural fue de 39,8%, disminuyó en 1,3 puntos porcentuales. El Instituto Nacional de Estadística e Informática (INEI) al presentar el documento Perú: Evolución de la Pobreza Monetaria 2014-2023: https://www.gob.pe/institucion/inei/informes-publicaciones/5558423-peru-evolucion-de-la-pobreza-monetaria-2014-2023, elaborado con los resultados de la Encuesta Nacional de Hogares (ENAHO), precisó que la población en condición de pobreza alcanzó a 9 millones 780 mil personas, cifra mayor en 596 mil personas, respecto al año 2022 (9 millones 184 mil personas).
Asimismo, dio a conocer que la población en situación de pobreza extrema, en el año 2023, fue de 5,7% que afectó a 1 millón 922 mil personas, es decir, 249 mil personas más que en el año 2022 (1 millón 673 mil personas).
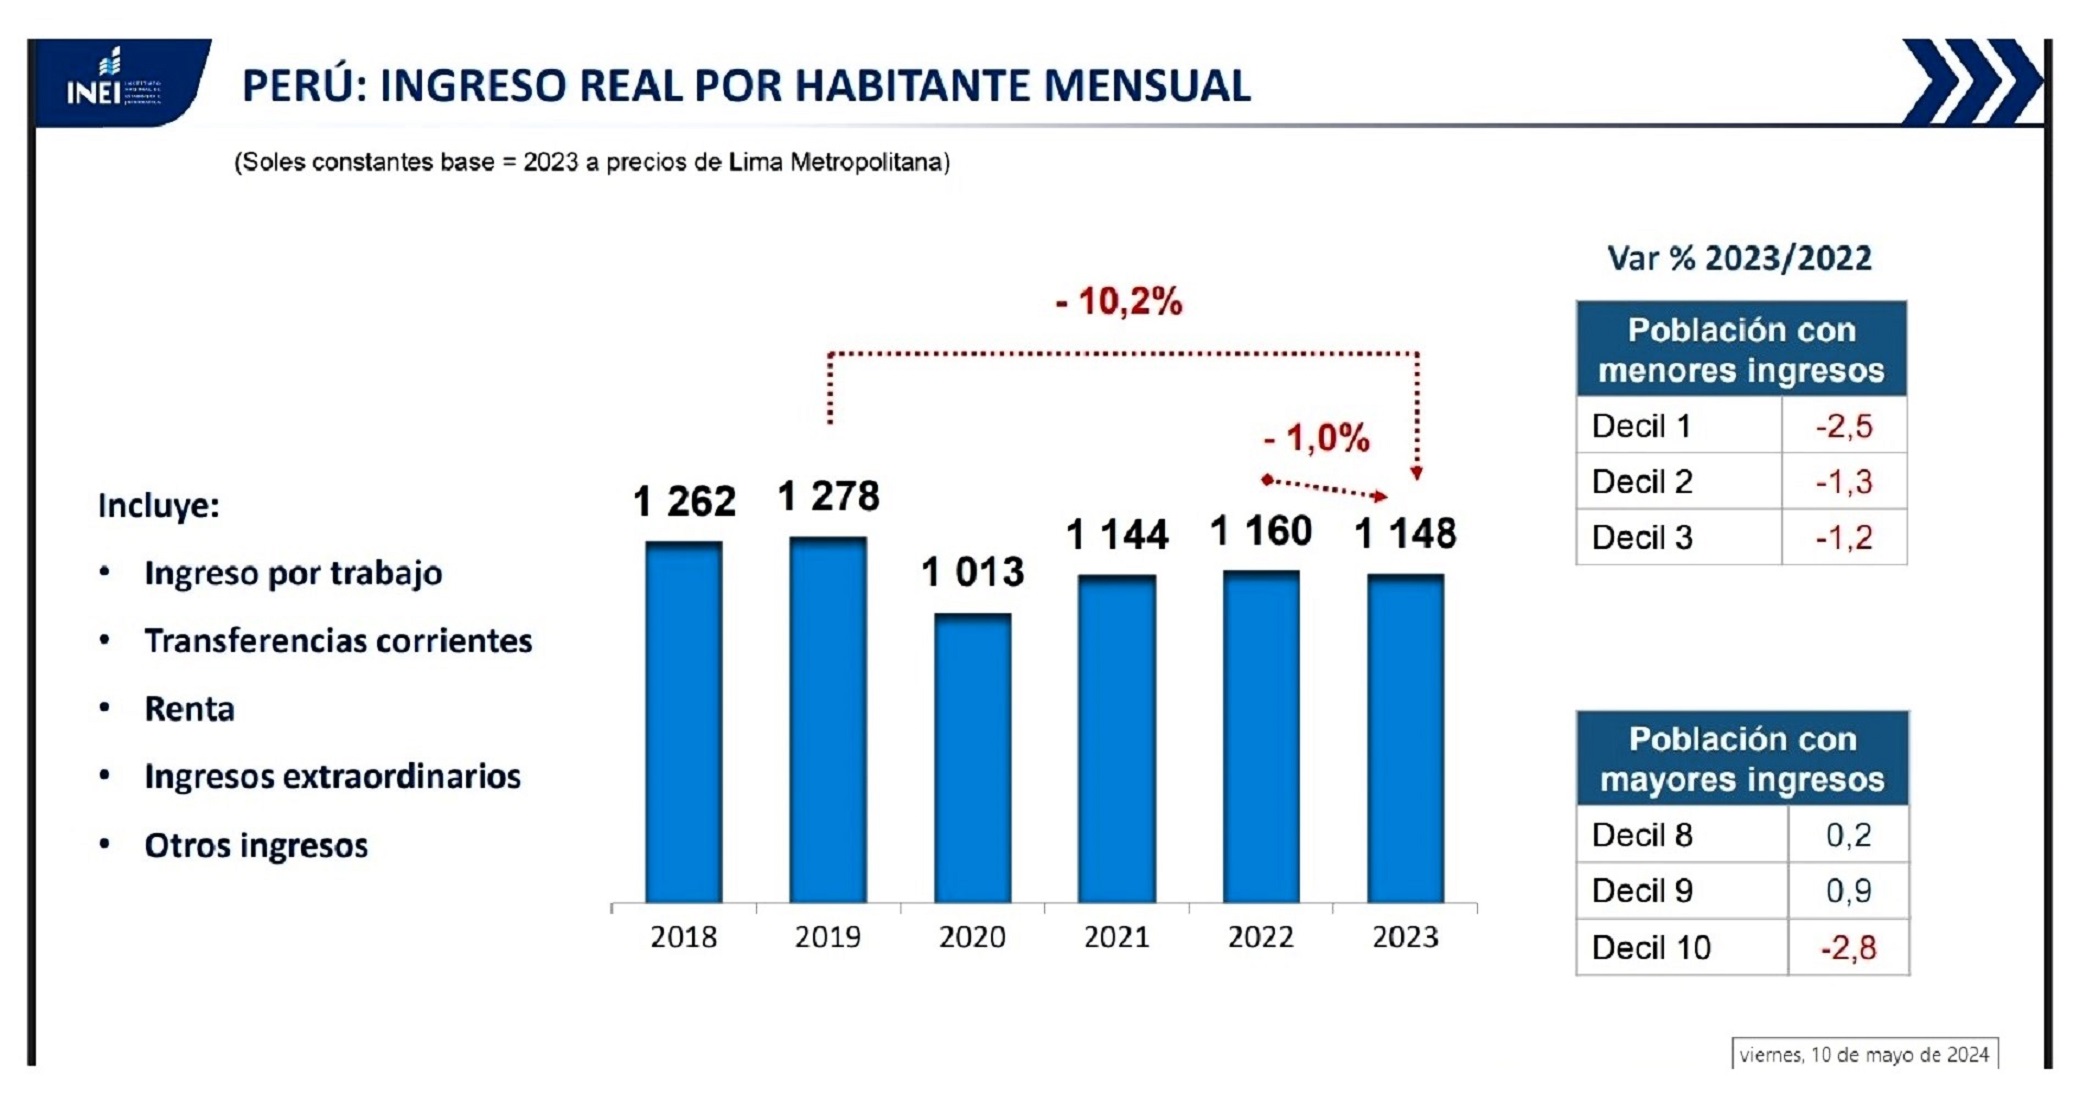
EN 1,0% DISMINUYÓ EL INGRESO REAL POR HABITANTE ENTRE LOS AÑOS 2022 Y 2023
El ingreso real por habitante se redujo en 1,0% entre los años 2022 y 2023 (de S/ 1,160 a S/ 1,148 soles). El ingreso real por habitante en el resto urbano disminuyó en 3,0% al pasar de S/ 1,241 a S/ 1,204. Sin embargo, en Lima Metropolitana y la Provincia Constitucional del Callao creció en 0,7% (de S/ 1,323 a S/1,332), seguido del área rural en 0,3% al aumentar de S/ 699 a S/ 700.
GASTO REAL POR HABITANTE MENSUAL DISMINUYÓ EN 0,7% ENTRE LOS AÑOS 2022 Y 2023
El gasto real mensual por habitante se redujo en 0,7%, al pasar de S/ 872 en el año 2022 a S/ 866 en el año 2023. En Lima Metropolitana y la Provincia Constitucional del Callao, el gasto real per cápita mensual se redujo en 0,4% (de S/ 972 a S/ 968), para los años 2022 y 2023, seguido del resto urbano en 1,8% al disminuir de S/ 935 a S/ 917. No obstante, aumentó en el área rural en 1,4% al pasar de S/ 561 a S/ 569.
LÍNEA DE POBREZA MONETARIA TOTAL Y EXTREMA
El INEI explicó que, la línea de pobreza, es el equivalente monetario al costo de una canasta básica de consumo de alimentos y no alimentos, que para el año 2023, asciende a S/ 446 al mes por habitante. Así para una familia con cuatro integrantes correspondería un monto de S/ 1784.
La medición de pobreza monetaria y extrema se realiza mediante el indicador del gasto debido a que esta variable se aproxima a la cuantificación de los niveles de vida a partir de lo que las personas y los hogares consumen, compran, adquieren productos y/o servicios. Para el año 2023, la canasta básica alimentaria es de S/ 251 y para una familia de cuatro integrantes S/1 004.
EVOLUCIÓN DE PRECIOS DE LOS PRODUCTOS QUE COMPONEN LA CANASTA BÁSICA DE ALIMENTOS
Del total de 110 principales productos que integran la canasta básica de alimentos, 95 registraron aumento de precios, siete redujeron precios y ocho no mostraron variación. Entre los productos que presentaron mayor variación de precios entre los años 2022 y 2023, destacaron el tomate (30,0%), cebolla de cabeza (27,3%), huevos a granel de gallina (24,1%) y el limón (21,4%), a nivel nacional.
CUATRO DEPARTAMENTOS PRESENTARON INCIDENCIA DE POBREZA SUPERIOR AL 40%
Los departamentos que presentaron mayor incidencia de pobreza, en el año 2023, fueron Cajamarca (44,5%), Loreto (43,5%), Pasco (41,7%) y Puno (41,6%). Por el contrario, presentaron menor incidencia Ica (6,9%), Moquegua (13,1%), Arequipa (13,9%), Madre de Dios (16,6%) y Lambayeque (17,9%).
POBREZA EXTREMA AFECTÓ AL 5,7% DE LA POBLACIÓN DEL PAÍS
Durante el año 2023, la pobreza extrema afectó al 5,7% de la población cifra superior en 0,7 punto porcentual en comparación con el año 2022 (5,0%). Así, la población en extrema pobreza se incrementó en 249 mil 400 personas, entre los años 2022 y 2023, es decir, 1 millón 673 mil personas y 1 millón 922 mil personas.
EN CUATRO DEPARTAMENTOS MÁS DEL 80% DE SU POBLACIÓN NO DISPONE DEL PAQUETE INTEGRADO DE SERVICIOS BÁSICOS
En el año 2023, el acceso al paquete integrado de servicios básicos que incluye agua, saneamiento, electricidad, telefonía móvil e Internet, no se encuentra disponible para el 83,5% de la población del departamento de Puno. Lo mismo ocurre con los departamentos de Ucayali (83,1%), Loreto (82,8%) y Huancavelica (81,1%). En cambio, este porcentaje es inferior en la Provincia Constitucional del Callao (23,7%), Lima Metropolitana (27,5%), Moquegua (32,7%) e Ica (39,7%).
VULNERABILIDAD MONETARIA AFECTA AL 31,4% DE LA POBLACIÓN DEL PAÍS
Durante el año 2023, del total de la población, el 31,4% se encuentra en riesgo de caer en situación de pobreza como resultado de cualquier cambio de las condiciones de la economía. No obstante, esta cifra es inferior a las registradas en los años 2022 (32,3%).
POBREZA MULTIDIMENSIONAL: DIMENSIONES E INDICADORES
Con el fin de medir la naturaleza multidimensional de la Pobreza, en cumplimiento del Decreto Supremo Nº002-2023-MIDIS que declara de prioridad nacional la elaboración y aprobación de la medición oficial de la pobreza multidimensional de manera complementaria a la medición de la pobreza monetaria en el marco de la implementación de la Política Nacional de Desarrollo e Inclusión Social (PNDIS) al 2030, se construyó un Tablero de Control de 08 dimensiones básicas del bienestar y 29 indicadores que representan carencias que limitan la calidad de vida de la población.
Del total de 29 indicadores del tablero de control, 13 incrementaron sus niveles de carencia, entre estos, creció en 4,2 puntos porcentuales la población urbana que fue víctima de algún hecho delictivo, alcanzando el 27,1%; en la dimensión educación aumentaron los estudiantes de segundo grado de secundaria que no alcanzaron los objetivos de aprendizaje esperados en Lectura y Matemática, alcanzando el 81,6% y 88,7%, respectivamente. En la dimensión servicios básicos, aumentó en 1,6 puntos porcentuales la población sin agua gestionada de manera segura, siendo esta el 73,7%. Por otra parte, entre las carencias que disminuyeron, se encuentra la población de 6 y más años de edad que no hace uso de internet con 22,9%, disminuyendo en 4,4 puntos porcentuales; y la población de 15 y más años de edad con presión arterial alta disminuyó 3,2 puntos porcentuales, alcanzando el 13,0%.
TRANSPARENCIA EN LA MEDICIÓN DE LA POBREZA
En la medición de la pobreza, el Instituto Nacional de Estadística e Informática está acompañado por una Comisión Consultiva, creada mediante Resolución Suprema Nº 097-2010-PCM. La Comisión tiene dentro de sus funciones: evaluar, supervisar y validar la calidad de la Encuesta Nacional de Hogares (ENAHO), referida a la metodología de medición de los indicadores de pobreza, asegurando la comparabilidad y propuesta de modificaciones y/o nuevas mediciones de pobreza.
La Comisión Consultiva está integrada por representantes del Ministerio de Economía y Finanzas (MEF), Ministerio de Desarrollo e Inclusión Social (MIDIS), Centro Nacional de Alimentación y Nutrición (CENAN), Banco Central de Reserva del Perú (BCRP), Mesa de Concertación para la Lucha Contra la Pobreza, Consorcio de Investigación Económica y Social (CIES), Grupo de Análisis para el Desarrollo (GRADE), Instituto de Estudios Peruanos (IEP), Pontificia Universidad Católica del Perú (PUCP) y Universidad del Pacífico (UP); Organismos Internacionales como Banco Mundial (BM), Banco Interamericano de Desarrollo (BID), Instituto de Investigación para el Desarrollo (IRD) del Gobierno Francés, Fondo de Población de las Naciones Unidas (UNFPA); así como expertos independientes de reconocida trayectoria técnica.
El INEI, en el marco de su política de difusión y transparencia de la información estadística que produce, pone a disposición de la ciudadanía en general la siguiente información: Nota de Prensa, documento Perú: Evolución de la Pobreza Monetaria 2014-2023, Base de Datos de libre acceso, Documentos metodológicos, Presentación de la Pobreza Monetaria 2014-2023 y la Declaración de la Comisión Consultiva de Medición de la Pobreza Monetaria, el público puede acceder a esta información ingresando a la Página Web del INEI: https://www.gob.pe/institucion/inei/informes-publicaciones/5558423-peru-evolucion-de-la-pobreza-monetaria-2014-2023
Fuente: Agencia Peruana de Noticias PRENSAPERU.PE https://prensaperu.pe/ Twitter: @prensaperupe

English Translation
Report on “Monetary Poverty” affected 29.0% of the population in 2023, increasing 1.5% compared to 2022, reported the INEI.
Peruvian News Agency PRENSAPERU.PE https://prensaperu.pe/ Twitter: @prensaperupe In 2023, monetary poverty affected 29.0% of the country’s population and increased by 1.5 percentage points compared to 2022 (27.5%). In the urban area it was 26.4%, increasing by 2.3 percentage points compared to the previous year; while in the rural area it was 39.8%, it decreased by 1.3 percentage points. The National Institute of Statistics and Informatics (INEI) when presenting the document Peru: Evolution of Monetary Poverty 2014-2023: https://www.gob.pe/institucion/inei/informes-publicaciones/5558423-peru-evolucion-de -monetary-poverty-2014-2023, prepared with the results of the National Household Survey (ENAHO), specified that the population in poverty reached 9 million 780 thousand people, a figure greater by 596 thousand people, compared to the year 2022 (9 million 184 thousand people).
Likewise, he announced that the population in a situation of extreme poverty, in the year 2023, was 5.7%, which affected 1 million 922 thousand people, that is, 249 thousand more people than in the year 2022 (1 million 673 a thousand people).
REAL INCOME PER INHABITAN DECREASES BY 1.0% BETWEEN THE YEARS 2022 AND 2023
Real income per inhabitant decreased by 1.0% between 2022 and 2023 (from S/ 1,160 to S/ 1,148 soles). Real income per inhabitant in the rest of the urban area decreased by 3.0%, going from S/ 1,241 to S/ 1,204. However, in Metropolitan Lima and the Constitutional Province of Callao it grew by 0.7% (from S/ 1,323 to S/ 1,332), followed by the rural area by 0.3%, increasing from S/ 699 to S/ 700.
REAL EXPENDITURE PER MONTHLY INHABITAN DECREASES BY 0.7% BETWEEN THE YEARS 2022 AND 2023
Real monthly spending per inhabitant was reduced by 0.7%, going from S/ 872 in 2022 to S/ 866 in 2023. In Metropolitan Lima and the Constitutional Province of Callao, real monthly per capita spending was decreased by 0.4% (from S/ 972 to S/ 968), for the years 2022 and 2023, followed by the rest of the urban population by 1.8%, decreasing from S/ 935 to S/ 917. However, it increased in the rural area by 1.4%, going from S/ 561 to S/ 569.
TOTAL AND EXTREME MONETARY POVERTY LINE
The INEI explained that the poverty line is the monetary equivalent of the cost of a basic food and non-food consumption basket, which by 2023, amounts to S/ 446 per month per inhabitant. Thus, for a family with four members, an amount of S/ 1784 would correspond.
The measurement of monetary and extreme poverty is carried out using the expenditure indicator because this variable approximates the quantification of living standards based on what people and households consume, buy, acquire products and/or services. For the year 2023, the basic food basket is S/ 251 and for a family of four members S/ 1,004.
PRICE EVOLUTION OF THE PRODUCTS THAT MAKE UP THE BASIC FOOD BASKET
Of the total of 110 main products that make up the basic food basket, 95 registered price increases, seven reduced prices and eight showed no variation. Among the products that presented the greatest price variation between 2022 and 2023, tomato (30.0%), head onion (27.3%), bulk chicken eggs (24.1%) and lemon stood out. (21.4%), at the national level.
FOUR DEPARTMENTS PRESENTED AN INCIDENCE OF POVERTY OVER 40%
The departments that had the highest incidence of poverty in 2023 were Cajamarca (44.5%), Loreto (43.5%), Pasco (41.7%) and Puno (41.6%). On the contrary, Ica (6.9%), Moquegua (13.1%), Arequipa (13.9%), Madre de Dios (16.6%) and Lambayeque (17.9%) had a lower incidence.
EXTREME POVERTY AFFECTED 5.7% OF THE COUNTRY’S POPULATION
During the year 2023, extreme poverty affected 5.7% of the population, a figure 0.7 percentage points higher compared to the year 2022 (5.0%). Thus, the population in extreme poverty increased by 249,400 people, between the years 2022 and 2023, that is, 1 million 673 thousand people and 1 million 922 thousand people.
IN FOUR DEPARTMENTS MORE THAN 80% OF ITS POPULATION DOES NOT HAVE THE INTEGRATED PACKAGE OF BASIC SERVICES
In the year 2023, access to the integrated package of basic services that includes water, sanitation, electricity, mobile telephony and Internet, is not available for 83.5% of the population of the department of Puno. The same occurs with the departments of Ucayali (83.1%), Loreto (82.8%) and Huancavelica (81.1%). On the other hand, this percentage is lower in the Constitutional Province of Callao (23.7%), Metropolitan Lima (27.5%), Moquegua (32.7%) and Ica (39.7%).
MONETARY VULNERABILITY AFFECTS 31.4% OF THE COUNTRY’S POPULATION
During the year 2023, of the total population, 31.4% are at risk of falling into poverty as a result of any change in economic conditions. However, this figure is lower than those registered in 2022 (32.3%).
MULTIDIMENSIONAL POVERTY: DIMENSIONS AND INDICATORS
In order to measure the multidimensional nature of Poverty, in compliance with Supreme Decree Nº002-2023-MIDIS that declares as a national priority the development and approval of the official measurement of multidimensional poverty in a complementary manner to the measurement of monetary poverty in Within the framework of the implementation of the National Development and Social Inclusion Policy (PNDIS) by 2030, a Control Board of 08 basic dimensions of well-being and 29 indicators that represent deficiencies that limit the quality of life of the population was built.
Of the total of 29 indicators on the control panel, 13 increased their deficiency levels. Among these, the urban population that was a victim of a criminal act grew by 4.2 percentage points, reaching 27.1%; In the education dimension, the number of second-grade secondary school students who did not achieve the expected learning objectives in Reading and Mathematics increased, reaching 81.6% and 88.7%, respectively. In the basic services dimension, the population without safely managed water increased by 1.6 percentage points, reaching 73.7%. On the other hand, among the shortcomings that decreased, is the population aged 6 and over that does not use the Internet with 22.9%, decreasing by 4.4 percentage points; and the population 15 years of age and older with high blood pressure decreased 3.2 percentage points, reaching 13.0%.
TRANSPARENCY IN POVERTY MEASUREMENT
In measuring poverty, the National Institute of Statistics and Informatics is accompanied by an Advisory Commission, created by Supreme Resolution No. 097-2010-PCM. The Commission’s functions include: evaluating, supervising and validating the quality of the National Household Survey (ENAHO), referring to the methodology for measuring poverty indicators, ensuring comparability and proposing modifications and/or new measurements of poverty.
The Advisory Commission is made up of representatives of the Ministry of Economy and Finance (MEF), Ministry of Development and Social Inclusion (MIDIS), National Center for Food and Nutrition (CENAN), Central Reserve Bank of Peru (BCRP), Concertation Table for the Fight Against Poverty, Consortium for Economic and Social Research (CIES), Analysis Group for Development (GRADE), Institute of Peruvian Studies (IEP), Pontificia Universidad Católica del Perú (PUCP) and Universidad del Pacífico (UP) ; International Organizations such as the World Bank (WB), Inter-American Development Bank (IDB), Development Research Institute (IRD) of the French Government, United Nations Population Fund (UNFPA); as well as independent experts with recognized technical experience.
The INEI, within the framework of its policy of dissemination and transparency of the statistical information it produces, makes the following information available to citizens in general: Press Release, document Peru: Evolution of Monetary Poverty 2014-2023, Base of Free access data, Methodological documents, Presentation of Monetary Poverty 2014-2023 and the Declaration of the Advisory Commission for the Measurement of Monetary Poverty, the public can access this information by entering the INEI Website: https://www .gob.pe/institucion/inei/informes-publicaciones/5558423-peru-evolucion-de-la-pobreza-monetaria-2014-2023
Source: Peruvian News Agency PRENSAPERU.PE https://prensaperu.pe/ Twitter: @prensaperupe