Agencia Peruana de Noticias PRENSAPERU.PE https://prensaperu.pe/ Twitter: @prensaperupe Las exportaciones manufactureras peruanas ascendieron a US$ 506 millones 406 mil en enero de este año, reflejando un incremento de 5.6% respecto al mismo mes del 2023 (US$ 479 millones 507 mil), por la mayor demanda de los sectores químico y siderometalúrgico, reportó la Gerencia de Manufacturas de la Asociación de Exportadores (ADEX).
Si bien es un inicio alentador, la gerenta de Manufacturas del gremio, Melissa Vallebuona Peña, explicó que 3 de sus sectores continúan en negativo: textil, confecciones y metalmecánica, mientras que los otros 3 mostraron crecimientos: químico, siderometalurgia y ‘varios’ (joyería, artesanía, papelería y otros).
“Las empresas se mostraron bastante resilientes ante las crisis internas y externas. Es alentador que, luego de varios meses en caída, inicien bien el año, pero apenas empieza y aún es muy pronto para proyectar una recuperación sostenida”, indicó.
EN CIFRAS
Con una representación de 32% del total, el rubro más importante de las exportaciones industriales fue el químico (US$ 161 millones 372 mil) con un alza de 19.1%. Sus principales partidas fueron aceites esenciales de limón, ácido sulfúrico, placas de polímeros de propileno, placas de polímeros de etileno, lacas colorantes, entre otras, mientras que sus mercados líderes lo conformaron EE.UU., Bolivia, Ecuador y Colombia.
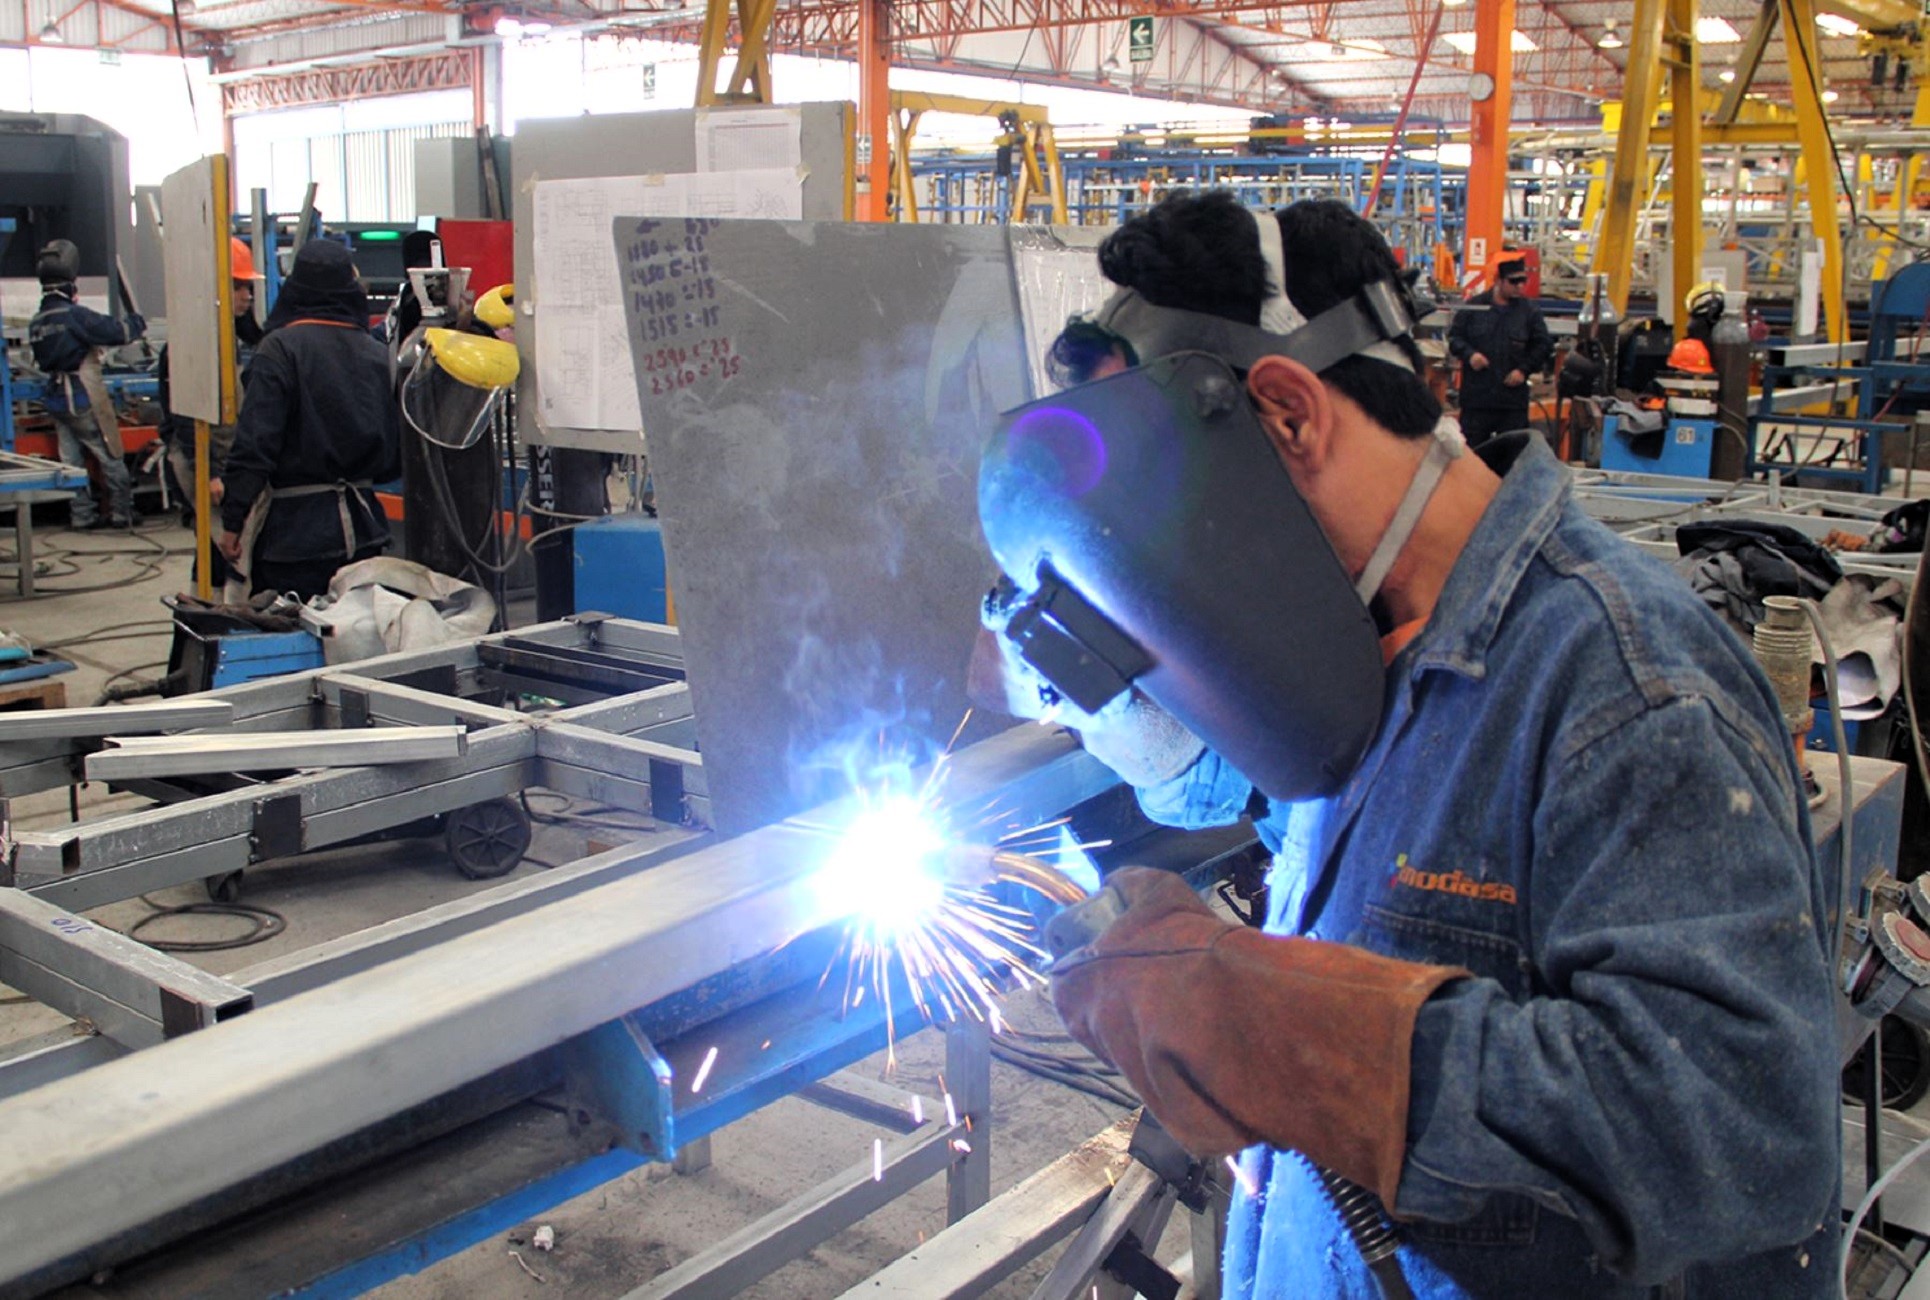
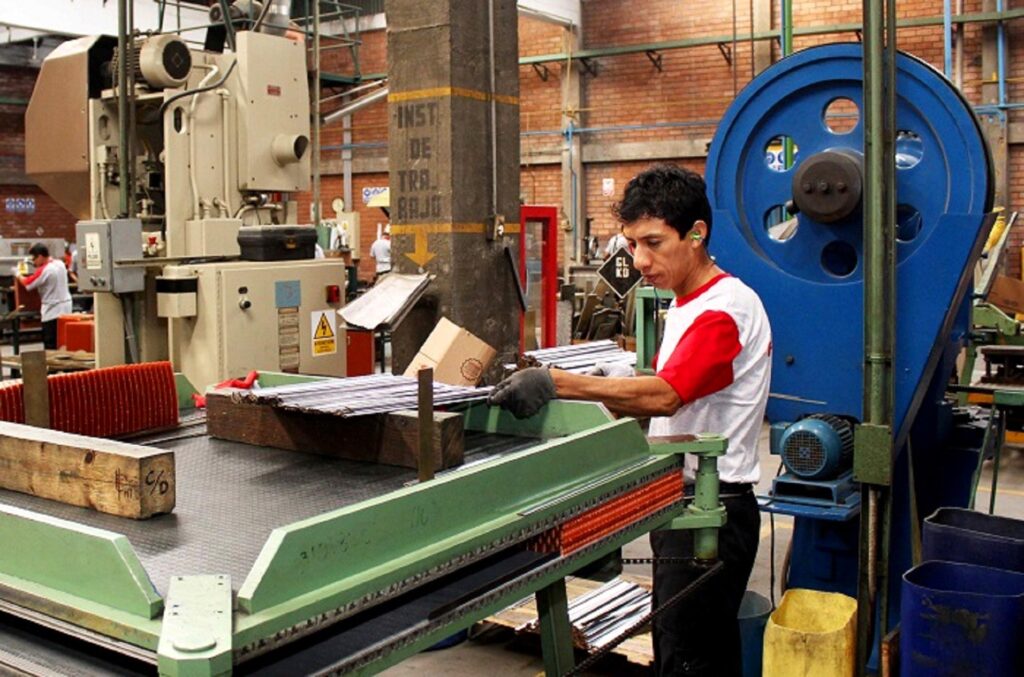
La siderometalurgia (US$ 134 millones 311 mil) representó el 26.5% de los despachos manufactureros y aumentó su demanda en 21.7%. Entre sus primeros destinos figuran EE.UU., Colombia, Brasil, México y Ecuador. Sus productos más representativos fueron alambre de cobre refinado, cinc sin alear, barras de hierro o acero sin alear, las demás chapas y tiras de cobre refinado, y barras y perfiles de cobre refinado.
Las confecciones (US$ 92 millones 937 mil) cerraron a la baja con -15.8%. Su oferta estuvo liderada por t-shirts de algodón, camisetas interiores de punto y camisas de punto, entre otros. EE.UU. concentró el 69.8% de esa oferta, seguido de Brasil, Francia, Canadá y Chile.
La metalmecánica (US$ 48 millones 109 mil) se contrajo en -8.6%. Entre sus partidas líderes estuvieron automóviles de más de 16 personas, partes de máquinas y aparatos, máquinas de sondeo o perforación y parabrisas, que se dirigieron a Chile, EE.UU., Bolivia, Ecuador y Colombia.
El rubro ‘varios’ llegó a los US$ 37 millones 768 mil, reflejando una variación positiva de 3.7% y aterrizando a mercados como EE.UU., Chile, Bolivia, Ecuador y Colombia. Los artículos de joyería, impresos publicitarios y rotuladores y marcadores se ubicaron en el top 3 de su oferta.
Finalmente, los textiles (U$ 31 millones 905 mil) disminuyeron -6.7%. El pelo fino cardado o peinado de alpaca, los hilados de lana y los demás tejidos de punto de algodón teñidos fueron sus productos más solicitados. Resaltaron por sus mayores pedidos China, EE.UU., Colombia, Italia y Bolivia.
DATOS
- EE.UU., con US$ 142 millones 265 mil, fue el principal mercado de la oferta industrial peruana al concentrar el 28.1% del total.
- Los despachos manufactureros peruanos sumaron US$ 6 mil 231 millones en el 2023 (enero-diciembre), reflejando un retroceso de -10.5% respecto al 2022.
Fuente: Agencia Peruana de Noticias PRENSAPERU.PE https://prensaperu.pe/ Twitter: @prensaperupe
English Translation
Peruvian manufacturing exports amounted to US$ 506 million 406 thousand, with 5.6% starting 2024 on the right foot.
Peruvian News Agency PRENSAPERU.PE https://prensaperu.pe/ Twitter: @prensaperupe Peruvian manufacturing exports amounted to US$ 506 million 406 thousand in January of this year, reflecting an increase of 5.6% compared to the same month in 2023 ( US$ 479 million 507 thousand), due to the greater demand from the chemical and iron and steel sectors, reported the Manufacturing Management of the Association of Exporters (ADEX).
Although it is an encouraging start, the union’s Manufacturing Manager, Melissa Vallebuona Peña, explained that 3 of its sectors continue to be negative: textile, clothing and metalworking, while the other 3 showed growth: chemical, steel metallurgy and ‘miscellaneous’ ( jewelry, crafts, stationery and others).
“Companies were quite resilient in the face of internal and external crises. It is encouraging that, after several months of decline, they are starting the year well, but it is just beginning and it is still too early to project a sustained recovery,” he indicated.
IN FIGURES
With a representation of 32% of the total, the most important item of industrial exports was chemicals (US$ 161 million 372 thousand) with an increase of 19.1%. Its main items were lemon essential oils, sulfuric acid, propylene polymer plates, ethylene polymer plates, color lakes, among others, while its leading markets were the US, Bolivia, Ecuador and Colombia.
Steel metallurgy (US$ 134 million 311 thousand) represented 26.5% of manufacturing shipments and increased its demand by 21.7%. Among its first destinations are the USA, Colombia, Brazil, Mexico and Ecuador. Its most representative products were refined copper wire, unalloyed zinc, iron or unalloyed steel bars, other refined copper sheets and strips, and refined copper bars and profiles.
Apparel (US$ 92 million 937 thousand) closed down with -15.8%. Its offering was led by cotton t-shirts, knitted undershirts and knitted shirts, among others. The US concentrated 69.8% of that supply, followed by Brazil, France, Canada and Chile.
Metalworking (US$ 48 million 109 thousand) contracted by -8.6%. Among its leading items were cars for more than 16 people, parts of machines and devices, drilling or drilling machines and windshields, which went to Chile, the United States, Bolivia, Ecuador and Colombia.
The ‘miscellaneous’ item reached US$ 37 million 768 thousand, reflecting a positive variation of 3.7% and reaching markets such as the US, Chile, Bolivia, Ecuador and Colombia. Jewelry items, advertising prints, and felt-tip pens and markers were in the top 3 of their offering.
Finally, textiles (U$ 31 million 905 thousand) decreased -6.7%. Fine carded or combed alpaca hair, wool yarn and other dyed cotton knitted fabrics were its most sought-after products. China, the US, Colombia, Italy and Bolivia stood out for their largest orders.
DATA
- The US, with US$ 142 million 265 thousand, was the main market for Peruvian industrial supply, concentrating 28.1% of the total.
- Peruvian manufacturing shipments totaled US$ 6,231 million in 2023 (January-December), reflecting a decline of -10.5% compared to 2022.
Source: Peruvian News Agency PRENSAPERU.PE https://prensaperu.pe/ Twitter: @prensaperupe