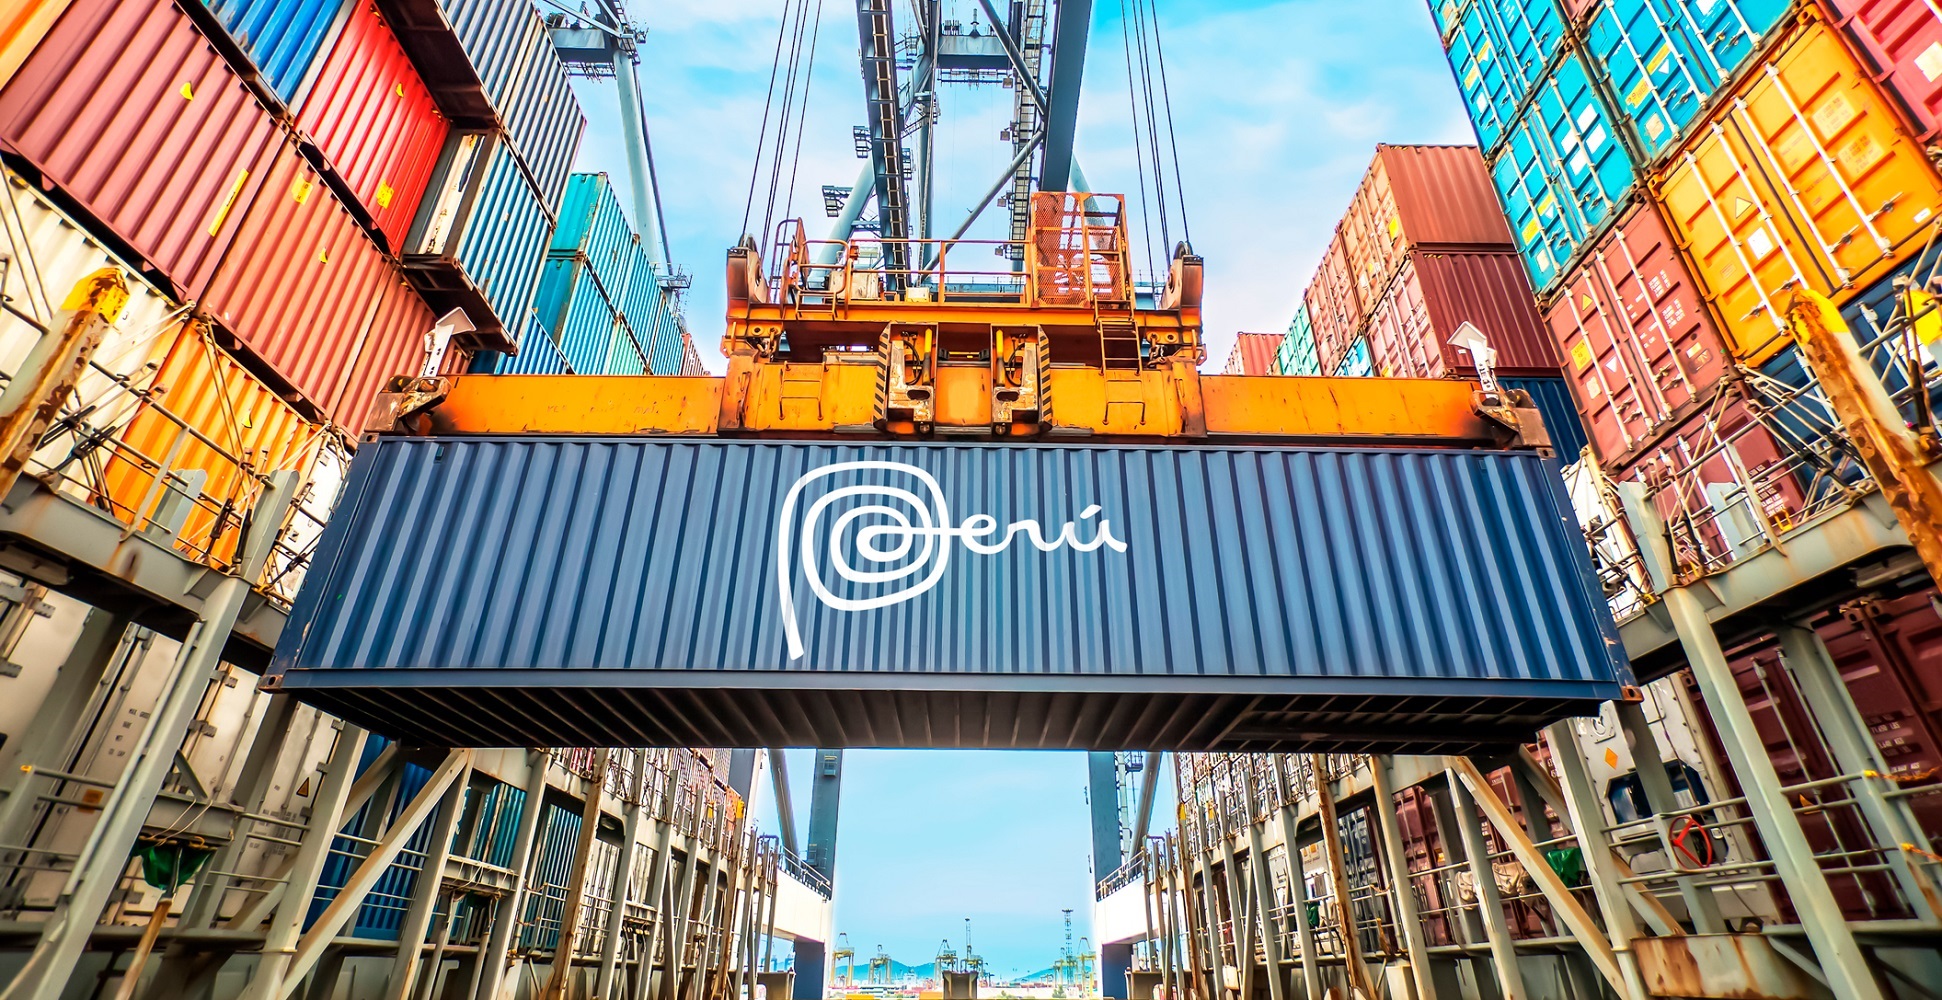
Agencia Peruana de Noticias PRENSAPERU.PE https://prensaperu.pe/ Twitter: @prensaperupe Entre enero y agosto las exportaciones peruanas ascendieron a US$ 41 mil 163 millones 717 mil, lo que indica una leve contracción de -1.1% en comparación al mismo periodo del 2022 cuando el monto ascendió a US$ 41 mil 632 millones 479 mil, informó la Asociación de Exportadores (ADEX).
En el detalle mensual se observó un retroceso de -6.9% en los envíos de agosto, acrecentando su intermitencia a lo largo del año con variaciones de -11.8% en enero, -13.3% en febrero, 8.3% en marzo, 6.4% en abril, 5.7% en mayo, -1.6% en junio y 7% en julio.
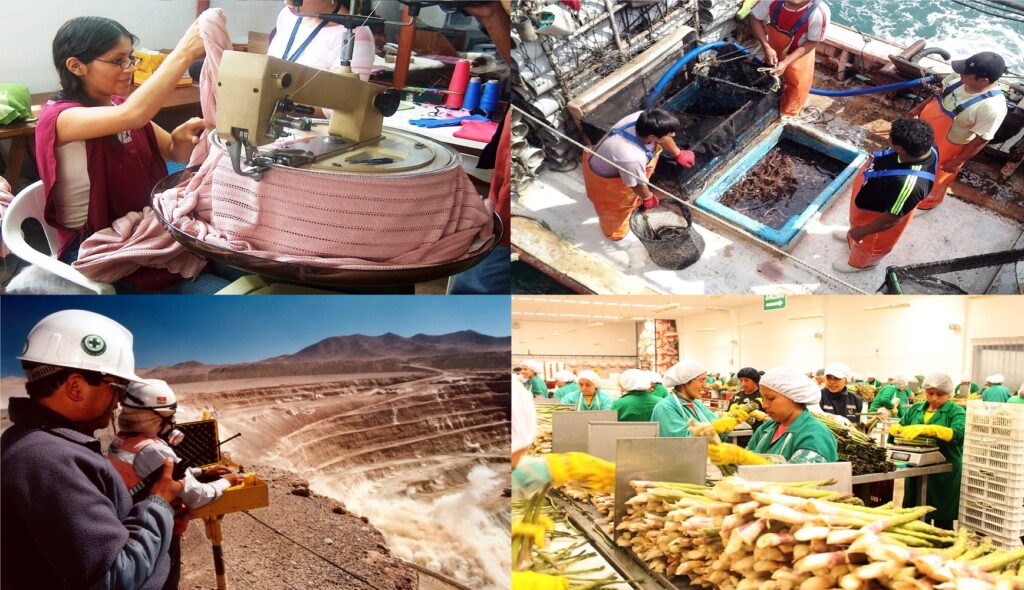
En el acumulado (8 meses) 9 de los 14 sectores presentaron cifras negativas: agro tradicional, pesca primaria, hidrocarburos, textil, confecciones, químico, siderometalúrgica, maderas y ‘varios’. Solo la minería, agroindustria, pesca para consumo humano directo, metalmecánica y minería no metálica tienen cifras positivas.
El Centro de Investigación de Economía y Negocios Globales de la Asociación de Exportadores CIEN-ADEX proyectó que en el 2023 los despachos peruanos (US$ 62 mil 800 millones) caerían -1.3%, aunque el panorama para el 2024 (US$ 64 mil 100 millones) variaría levemente, estimando un incremento de 1.9%.
Las proyecciones se explican por factores externos como las menores cotizaciones promedio de los commodities mineros, hidrocarburos y agrícolas, además de la desaceleración de la tasa de crecimiento económica mundial, que pasará de 3.5% en el 2022 a 3% en el 2023 y 2024, según el último reporte del Fondo Monetario Internacional (FMI).
Asimismo, por factores internos como los conflictos sociales (observados en los dos primeros meses del 2023) y el clima adverso a consecuencia del fenómeno de El Niño, que incidirán en el desempeño exportador.
DESPACHOS TRADICIONALES
Cifras del Sistema de Inteligencia Comercial ADEX Data Trade refieren que, entre enero y agosto de este año, el sector tradicional (US$ 29 mil 726 millones) acumuló el 72.2% del total y experimentó una caída de -1.3%.
La minería tradicional (US$ 25 mil 638 millones 777 mil) lideró los envíos al registrar un aumento de 11%; sin embargo, los otros 3 rubros presentaron contracciones: hidrocarburos (-37.3%), agro (-44.5%) y pesca (-51.1%).
Sus principales productos fueron el cobre (US$ 13 mil 021 millones 261 mil) y oro (US$ 5 mil 074 millones 957 mil), que representaron el 60.5% del total. Se sumaron los cátodos de cobre refinado, cinc, hierro, gas natural licuado, molibdeno, plomo, harina de pescado y residual 6, entre otros.
Esta oferta llegó a China (US$ 14 mil 454 millones), agrupando el 48.6% del total. El top ten lo completaron EE.UU., Canadá, Japón, Corea del Sur, India, Suiza, Brasil, España y Emiratos Árabes Unidos, llegando a un total de 78 países.
DESPACHOS NO TRADICIONALES
Por otra parte, los despachos con valor agregado entre enero y agosto acumularon poco más de US$ 11 mil 437 millones, reflejando un retroceso de -0.8% en comparación al mismo periodo del 2022. Su participación fue del 27.8% del total. Preocupa que agosto sea el cuarto mes en rojo luego de crecer en enero, febrero, marzo y abril con 6%, 8%, 3%, y 7%. Mayo, junio, julio y agosto cerraron con -1%, -6%, -11% y -9%, respectivamente.
El rubro líder fue el agropecuario-agroindustrial con US$ 5 mil 046 millones 202 mil y una concentración de 12.2%. Otros que destacaron por monto US$ FOB fueron la pesca para consumo humano directo (US$ 1,324 millones 461 mil), químico (US$ 1,312 millones 388 mil), siderometalurgia (US$ 1,032 millones) y minería no metálica (US$ 805 millones 589 mil).
Según el Sistema de Inteligencia Comercial ADEX Data Trade, la cartera de productos no tradicionales estuvo compuesta por paltas (US$ 927 millones 420 mil), uvas (US$ 658 millones 865 mil) y pota congelada (US$ 509 millones 249 mil). También por fosfatos de calcio naturales, arándanos y otros.
En ese periodo, fueron 165 los destinos de este portafolio. El N° 1 fue EE.UU. (US$ 3 mil 106 millones); sin embargo, redujo sus pedidos en -9%. Completaron el top ten Países Bajos, Chile, China, Ecuador, España, México, Colombia, Brasil y Bolivia. De estos 10 primeros lugares, la mayor variación la consiguió China (56.4%).
MÁS INFORMACIÓN
Si desea leer el informe de las proyecciones de las exportaciones del CIEN-ADEX puede hacer click https://www.cien.adexperu.org.pe/reporte-de-proyeccion-de-las-exportaciones-octubre-2023/
Fuente: Agencia Peruana de Noticias PRENSAPERU.PE https://prensaperu.pe/ Twitter: @prensaperupe
English Translation
Peruvian exports fell -1.1% between January and August, 9 of the 14 sectors closed in red, reported the first export union ADEX.
Peruvian News Agency PRENSAPERU.PE https://prensaperu.pe/ Twitter: @prensaperupe Between January and August, Peruvian exports amounted to US$ 41,163,717,000, which indicates a slight contraction of -1.1% compared to the previous year. same period of 2022 when the amount amounted to US$ 41,632,479,000, reported the Association of Exporters (ADEX).
In the monthly detail, a decline of -6.9% was observed in shipments in August, increasing its intermittency throughout the year with variations of -11.8% in January, -13.3% in February, 8.3% in March, 6.4% in April , 5.7% in May, -1.6% in June and 7% in July.
In the accumulated (8 months) 9 of the 14 sectors presented negative figures: traditional agriculture, primary fishing, hydrocarbons, textiles, clothing, chemicals, iron and steel, wood and ‘miscellaneous’. Only mining, agroindustry, fishing for direct human consumption, metalworking and non-metallic mining have positive figures.
The Global Economy and Business Research Center of the CIEN-ADEX Exporters Association projected that in 2023 Peruvian shipments (US$ 62,800 million) would fall -1.3%, although the outlook for 2024 (US$ 64,100 million) would vary slightly, estimating an increase of 1.9%.
The projections are explained by external factors such as the lower average prices of mining, hydrocarbon and agricultural commodities, in addition to the slowdown in the global economic growth rate, which will go from 3.5% in 2022 to 3% in 2023 and 2024. according to the latest report from the International Monetary Fund (IMF).
Likewise, due to internal factors such as social conflicts (observed in the first two months of 2023) and adverse weather as a result of the El Niño phenomenon, which will affect export performance.
TRADITIONAL OFFICES
Figures from the ADEX Data Trade Commercial Intelligence System indicate that, between January and August of this year, the traditional sector (US$ 29,726 million) accumulated 72.2% of the total and experienced a drop of -1.3%.
Traditional mining (US$ 25,638,777,000) led shipments by registering an increase of 11%; However, the other 3 items showed contractions: hydrocarbons (-37.3%), agriculture (-44.5%) and fishing (-51.1%).
Its main products were copper (US$ 13,021 million 261 thousand) and gold (US$ 5,074 million 957 thousand), which represented 60.5% of the total. The cathodes of refined copper, zinc, iron, liquefied natural gas, molybdenum, lead, fish meal and residual 6, among others, were added.
This offer reached China (US$ 14,454 million), accounting for 48.6% of the total. The top ten was completed by the US, Canada, Japan, South Korea, India, Switzerland, Brazil, Spain and the United Arab Emirates, reaching a total of 78 countries.
NON-TRADITIONAL OFFICES
On the other hand, shipments with added value between January and August accumulated just over US$ 11,437 million, reflecting a decline of -0.8% compared to the same period in 2022. Their participation was 27.8% of the total. It is worrying that August is the fourth month in the red after growing in January, February, March and April with 6%, 8%, 3%, and 7%. May, June, July and August closed with -1%, -6%, -11% and -9%, respectively.
The leading sector was agriculture-agroindustrial with US$ 5,046,202,000 and a concentration of 12.2%. Others that stood out in terms of US$ FOB amount were fishing for direct human consumption (US$ 1,324 million 461 thousand), chemicals (US$ 1,312 million 388 thousand), iron and steel (US$ 1,032 million) and non-metallic mining (US$ 805 million). 589 thousand).
According to the ADEX Data Trade Commercial Intelligence System, the portfolio of non-traditional products was made up of avocados (US$ 927 million 420 thousand), grapes (US$ 658 million 865 thousand) and frozen squid (US$ 509 million 249 thousand). Also for natural calcium phosphates, blueberries and others.
In that period, there were 165 destinations in this portfolio. No. 1 was the United States (US$ 3,106 million); However, it reduced its orders by -9%. The Netherlands, Chile, China, Ecuador, Spain, Mexico, Colombia, Brazil and Bolivia completed the top ten. Of these top 10 places, the greatest variation was achieved by China (56.4%).
MORE INFORMATION
If you want to read the CIEN-ADEX export projections report, you can click https://www.cien.adexperu.org.pe/reporte-de-proyeccion-de-las-exportaciones-octubre-2023/
Source: Peruvian News Agency PRENSAPERU.PE https://prensaperu.pe/ Twitter: @prensaperupe